Star plots allow one to view multiple variables in a clear form. The plot above is showing MER IDD and automated designs.
Thursday, April 17, 2014
Similarity matrix

Similarity matrix shows similarities between a set of data points. Above shows distances between 13 different locations on the Isle of Wight
Correlation matrix
 http://www.biomedcentral.com/1471-2164/8/353/figure/F5?highres=y
A correlation matrix will show the correlation between multiple variables.
Stem and leaf plot

Stem and leaf plots show the frequency as which a variable occurs. The steam and leaf plot above is a basic exams of what a complex plot wold look like.
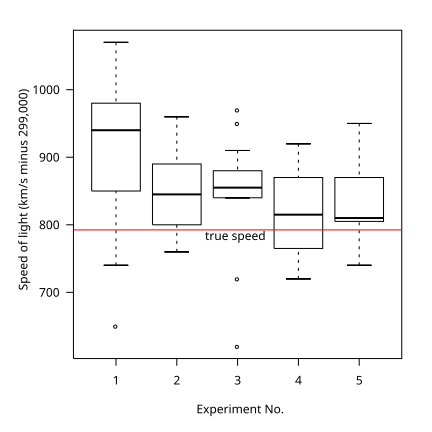
Box plot
 http://upload.wikimedia.org/wikipedia/commons/f/fa/Michelsonmorley-boxplot.svg
Box plots depict groups of numerical data with each box representing he parameter of the data set the extending lines from the boxes are whiskers that show the variation from the upper and lower limits if the box. Box plots are non-parametric. The plot above is showing measurement of the speed of light.
Histogram
 http://upload.wikimedia.org/wikipedia/commons/c/c3/Histogram_of_arrivals_per_minute.svg
A histogram is a graphical display of the distribution of data in bar form. This histogram shoes the frequency of arrivals per minute.
Parallel coordinate graph
Parallel coordinate graphs are created to display large amounts of information. They are not mainly used to indicate change, but to express large amounts of data. Each variable is graphed on the vertical axis. Age, Number of years of study, Race, Sex, Hours-per-week are the variables being measured in trying to determine the influence of the revenue of the individuals.
Subscribe to:
Posts (Atom)