 http://upload.wikimedia.org/wikipedia/commons/f/fa/Michelsonmorley-boxplot.svg
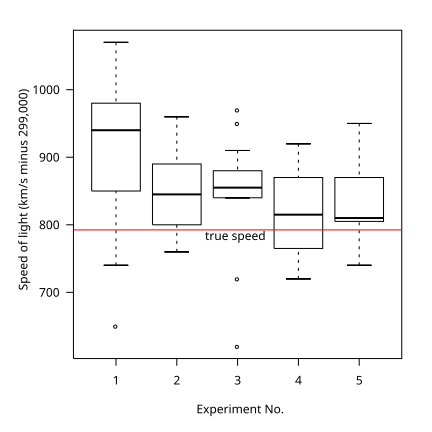
Box plots depict groups of numerical data with each box representing he parameter of the data set the extending lines from the boxes are whiskers that show the variation from the upper and lower limits if the box. Box plots are non-parametric. The plot above is showing measurement of the speed of light.
No comments:
Post a Comment