MapCatalog

Thursday, April 17, 2014

Bivariate choropleth map

https://blogger.googleusercontent.com/img/b/R29vZ2xl/AVvXsEgLe5OgQ2UdDu8MVGGd03JiCpqrj2LqlzPhlYY5kpY9ar-eVP6NQBYzYXMV5pJUfFI7cK4nbeOF7IxB6qtdR9kKo-Zs7bccmUmXS1FXB72Jltwr42U_MqpVNvslaTlUcCq5BoHCJqNEB8IA/s1600/small_multiples.jpghttps://www.e-education.psu.edu/geog486/book/export/html/1800
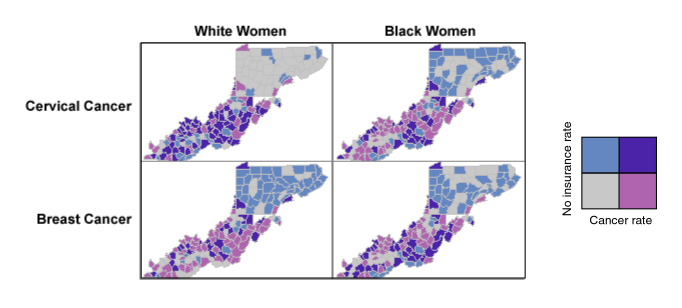
 Bivariate choropleth maps show two sets of data, unlike the univariate that only shows one type. Above the map shows cancer within white and black women and how it compares.
Posted by Unknown at 6:07 PM
Email ThisBlogThis!Share to XShare to FacebookShare to Pinterest

No comments:

Post a Comment

Newer Post Older Post Home
Subscribe to: Post Comments (Atom)

Blog Archive

  • ▼  2014 (50)
    • ▼  April (50)
      • Star Plot
      • Similarity matrix
      • Correlation matrix
      • Stem and leaf plot
      • Box plot
      • Histogram
      • Parallel coordinate graph
      • Triangular plot
      • Windrose
      • Climograph
      • Population profile
      • Scatterplot
      • Dot distribution map
      • Accumulative line graph/Lorenz curve
      • Bilateral graph
      • Nominal area choropleth map
      • Unstandardized choropleth map
      • Standardized choropleth map
      • Univariate choropleth map
      • Bivariate choropleth map
      • Flow map
      • Unclassed choropleth map
      • DOQQ
      • DEM
      • DLG
      • DRG
      • Isopleths
      • Isopach
      • Isohyets
      • Isotachs
      • Isobars
      • LIDAR
      • Doppler radar
      • Black & white arial photo
      • Infrared arial photo
      • Cartographic animation
      • Statistical map
      • Cartogram
      • Isoline map
      • Proportional circle map
      • Choropleth map
      • Dot distribution map
      • Propaganda map
      • Hypsometric map
      • Cadastral map
      • PLSS map
      • Topographic map
      • Thematic map
      • Planimetric map
      • Mental Map

About Me

Unknown
View my complete profile
Simple theme. Powered by Blogger.