 http://oklo.org/2011/02/
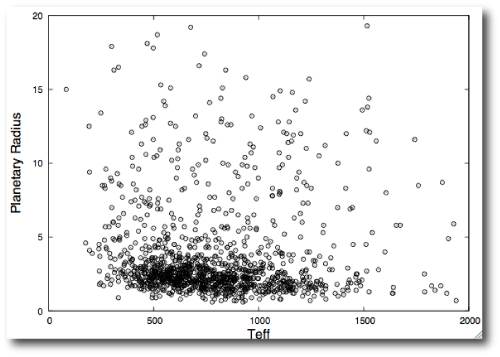
A scatter plot is a graph of plotted data points. Based on the orientation of the dots (the closure together dots are the general average where as the farther spaced ones are not as of accurate of points that can be known as outliers) one can get a general trend of what has been plotted. Many of the scatter plots add a trend line to depict the average trend. The graph above is plotting planetary effective temperature vs planetary radius.
No comments:
Post a Comment